User Guide
Step-By-Step
Overview
EPIphany is a platform for epitope microarray analysis, no download or registration required!EPIphany features a synoptic analysis, which provides an initial overview of the data after background adjustment and normalization, and a targeted analysis for more advanced visualizations. The synoptic analysis form is featured on the Homepage, as the results of this analysis are required to proceed with the optional targeted analysis.
Synoptic Data Upload
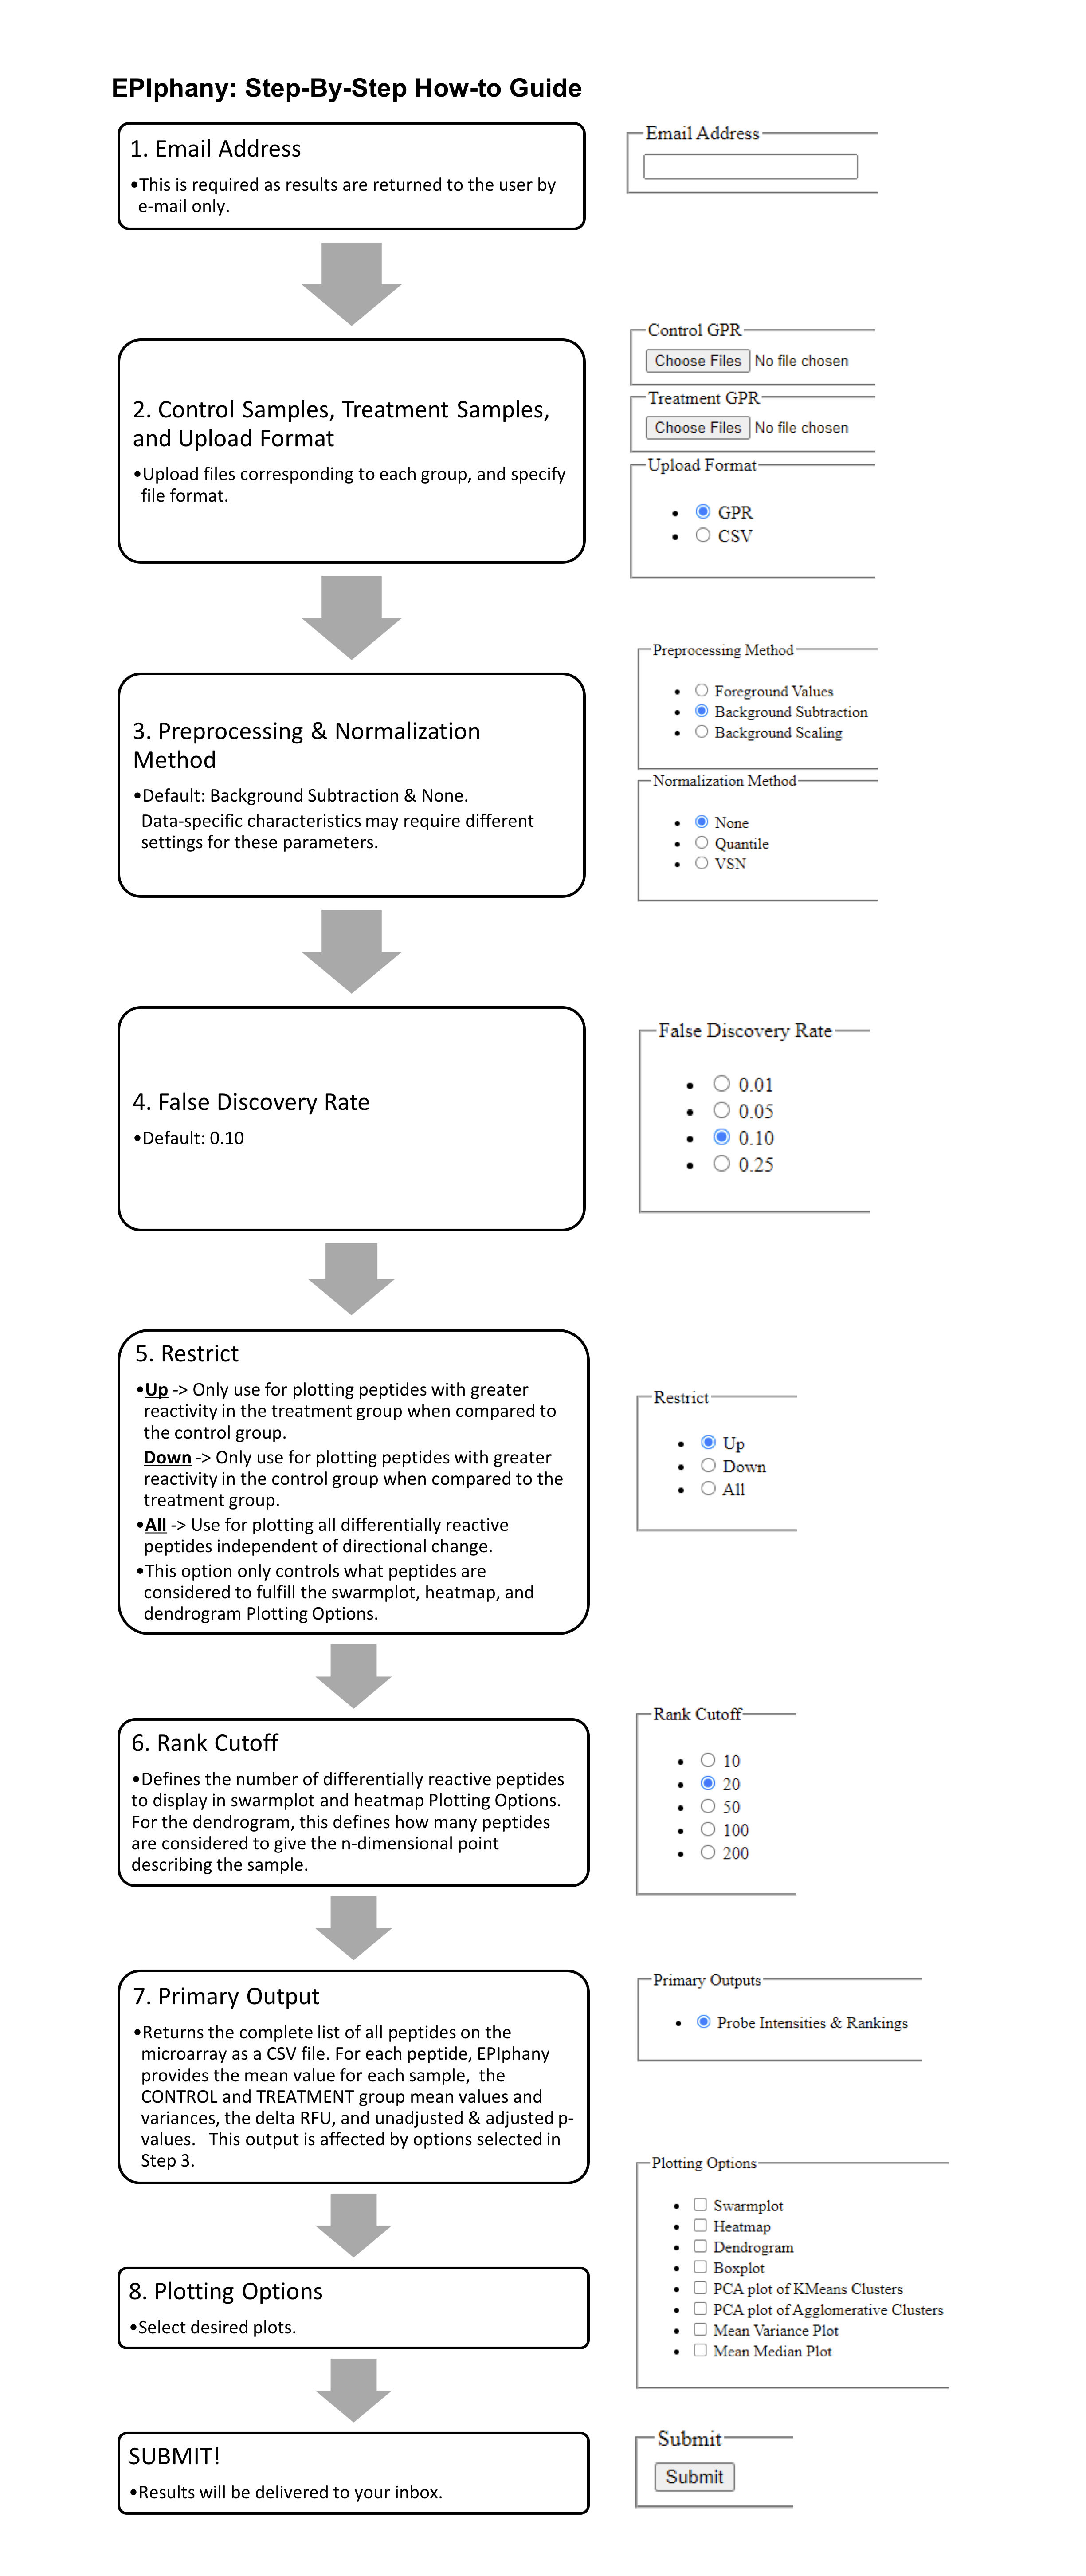
EPIphany accepts input for synoptic analysis in GPR or CSV format, where each file contains the probe intensities from one microarray. The GPR format is best for users of GenePix Pro Software - GPR files may be uploaded directly to EPIphany, no modification required. Otherwise, CSV files must formatted by the user to contain the following 4 columns: PROBE ID, SEQUENCE, FOREGROUND, and BACKGROUND, where FOREGROUND and BACKGROUND are the foreground and background probe intensities.Treatment and Control files are uploaded in separate batches, and the number of probes and their IDs must be the same across files.
Background Correction
Background adjustment accounts for noise in the probe intensities, which may be caused by non-specific binding between probes and antibodies. Two methods of background adjustment are available, including background subtraction and background scaling.Background subtraction uses the result of subtracting the mean background intensity from the mean foreground intensity for each probe. Background scaling further scales this result by a ratio of the background median of the entire array over the background mean of the individual probe.
Normalization
Normalization is applied to mitigate the variation between individual microarrays. Two methods of normalization are currently implemented. Quantile normalization equalizes the distribution of each array in the data set. Variance stabilizing normalization assumes that variance increases as the mean probe intensity increases and transforms the data such that the variance is independent of mean values.Scoring
In order to determine whether the distribution of the control probe intensities is different from the distribution of the treatment probe intensities, a Mann-Whitney U test is applied to each peptide on the arrays. The two groups of values supplied to the Mann-Whitney U test are the set of control probe intensities for a particular peptide and the set of treatment probe intensities for the same peptide. The statistical significance in the output CSV file is reported as the resulting p-value, where a smaller p-value indicates that the distribution of the control intensities is significantly different than the distribution of the treatment intensities. The user may also choose to correct the p-values with a False Discovery Rate (FDR), and select from a range of values for alpha. Both the uncorrected and corrected p-values are reported.The delta Relative Fluorescence Unit (delta RFU) measures the difference between the mean control probe intensity and mean treatment probe intensity. Delta RFU is reported for every peptide on the microarray.
Rank Cutoff and Restriction
Users may change the rank cutoff and restriction settings to select the criteria used in creating dendrograms, swarmplots, and heatmaps. These plots display only the “top” probes in the statistical significance and delta RFU categories. Rank cutoff refers to the number of probes displayed.The restriction control is used define the criteria for a “top” probe in the delta RFU category. The available options are “up”, “down”, or “all”. “Up” selects the probes with the most positive values for delta RFU, whereas “down” selects the probes with the most negative values for delta RFU. “All” selects the probes with the largest delta RFU, regardless of direction (largest absolute value).
Visualization
Several visualization may be produced by EPIphany during both the synoptic and targeted analyses. For synoptic analysis, simply click the checkboxes of any listed visualizations before submitting the form to add them to the list of emailed results. For targeted analysis, the user must submit the CSV output from the synoptic analysis as well as an additional file that specifies which peptides will be featured on the visualizations.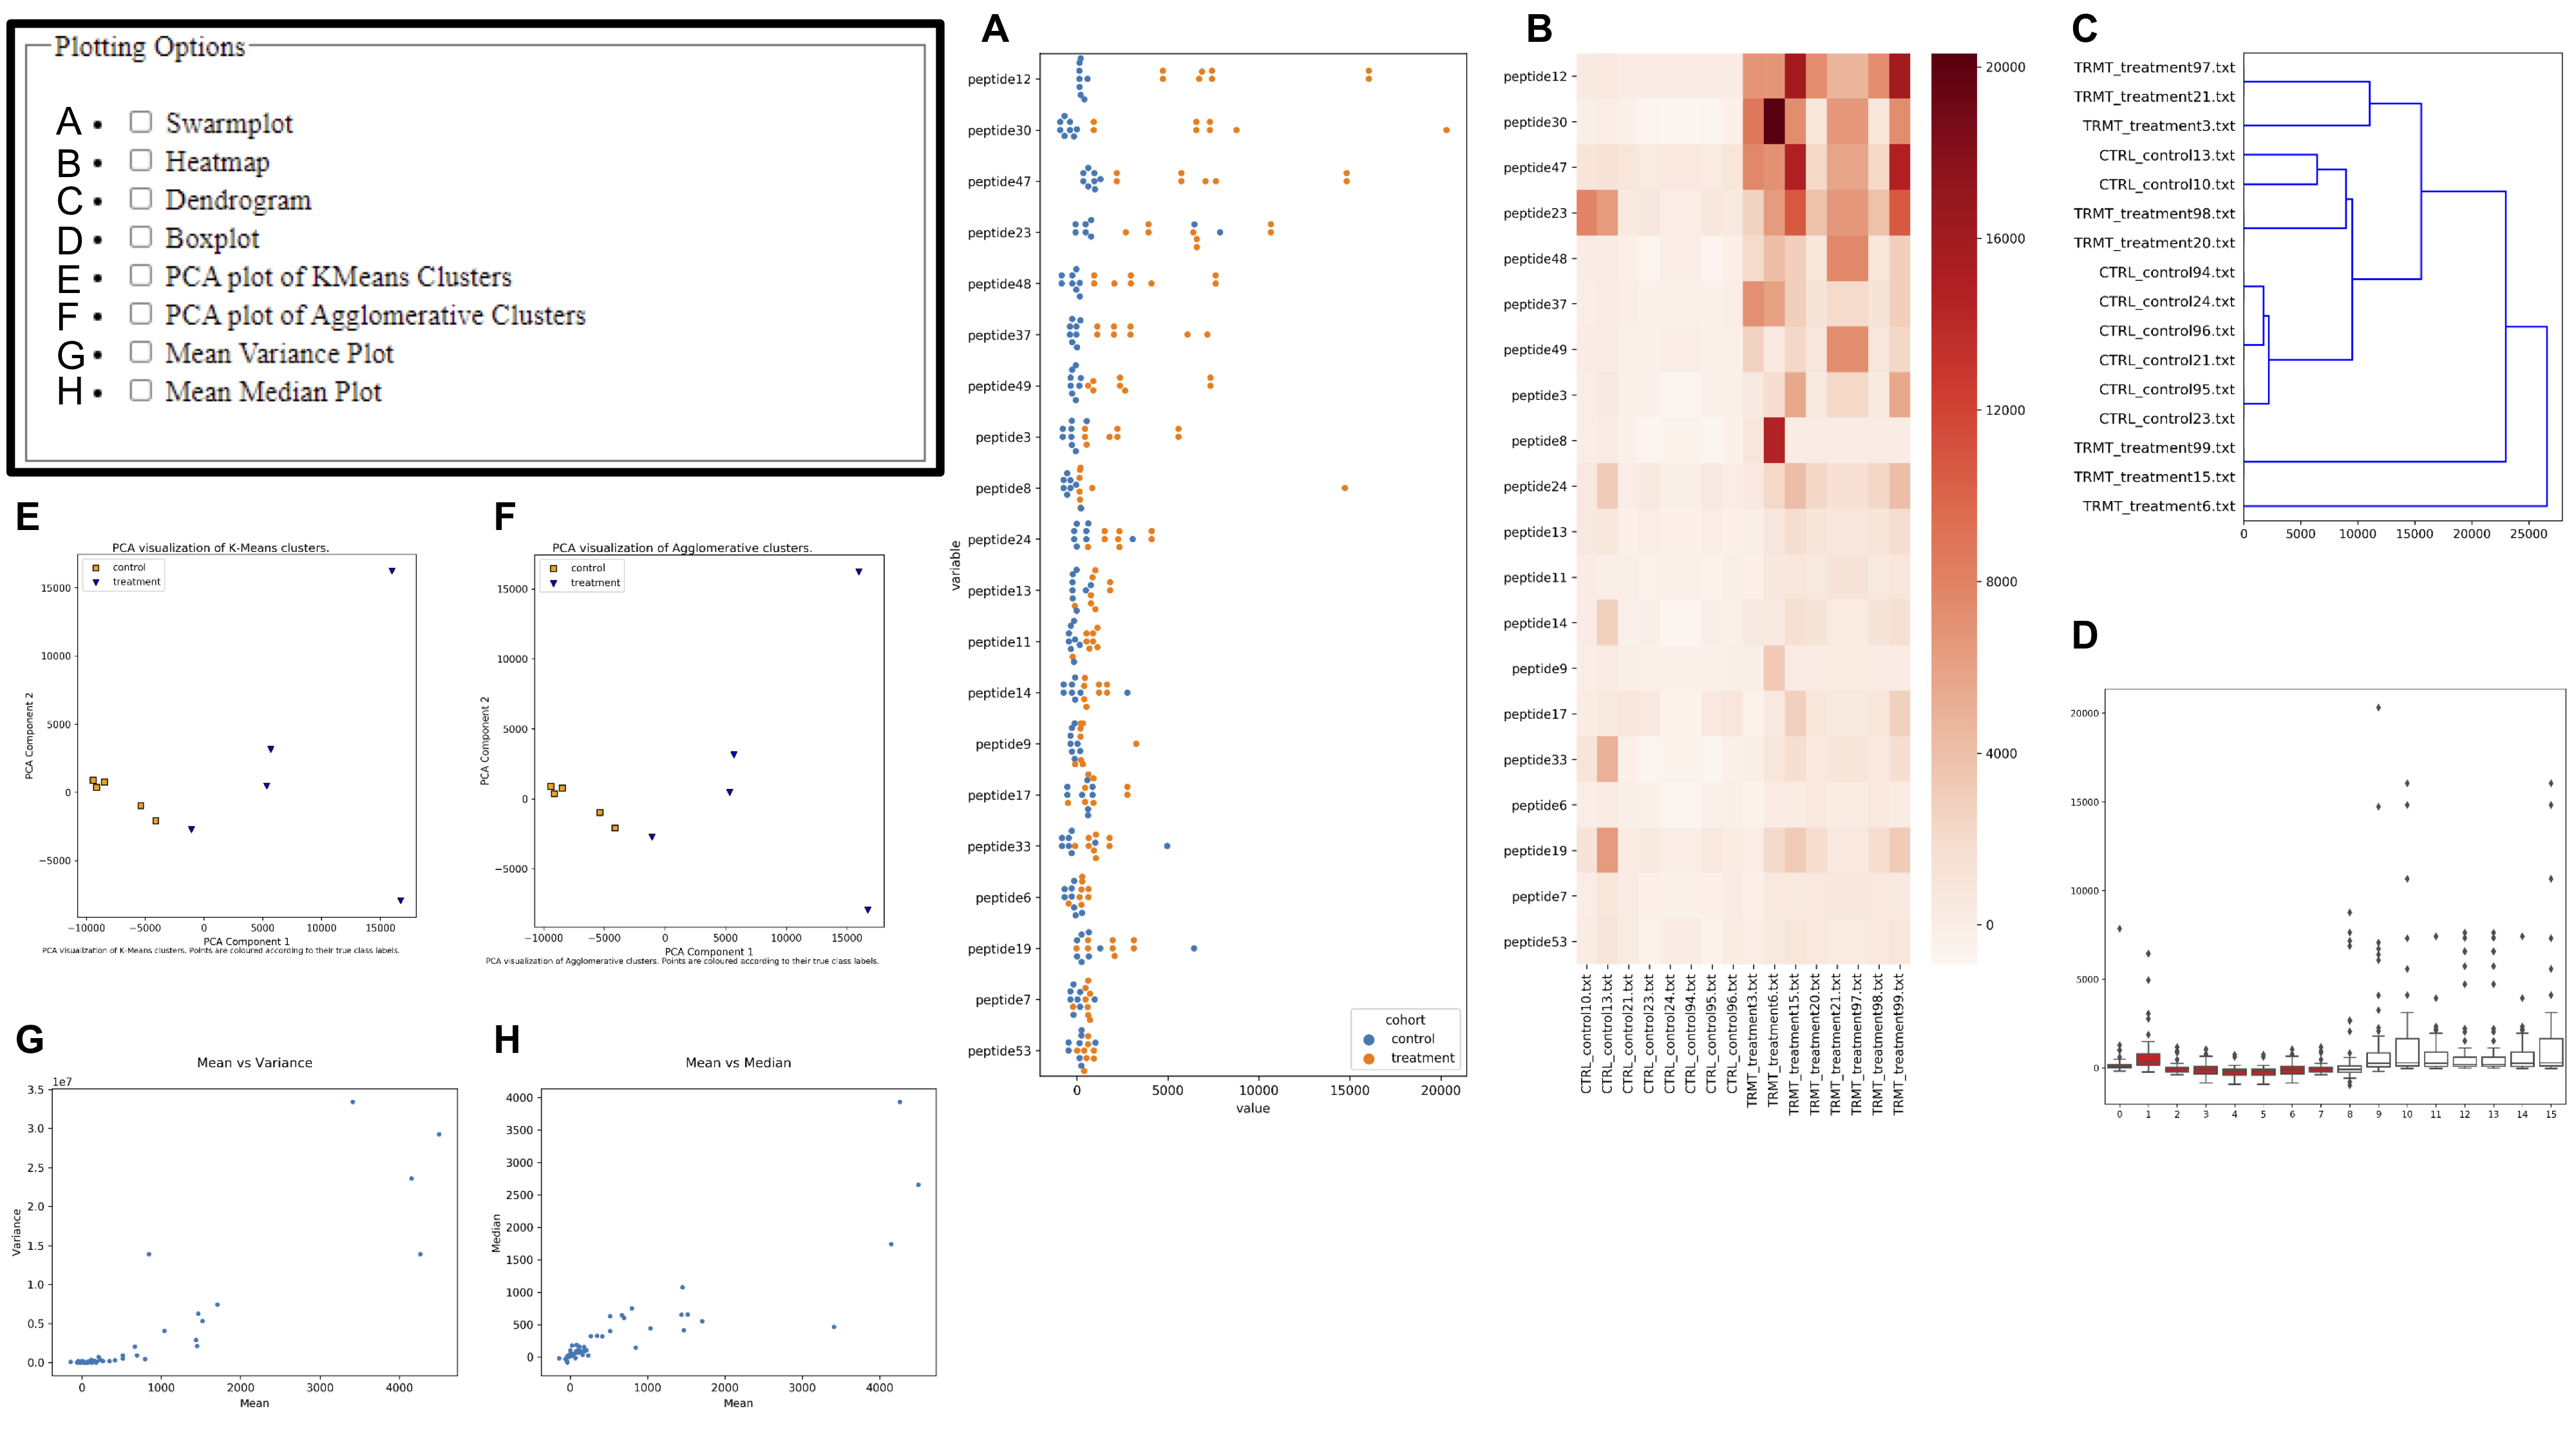
Results
When EPIphany has finished analyzing the data, results will be sent through email. These results will include a CSV file containing probe intensities and other statistical information, as well as any other visualizations that were selected before the EPIphany form was submitted.Targeted Analysis
After receiving the results of the synoptic analysis, users may decided to proceed with the targeted analysis. The targeted analysis requires the user to upload the CSV file from the synoptic analysis, as well as an additional CSV file that specifies which peptides are plotted on the targeted analysis visualizations. These visualizations include lineplots, stripplots, heatmaps, and epitope maps.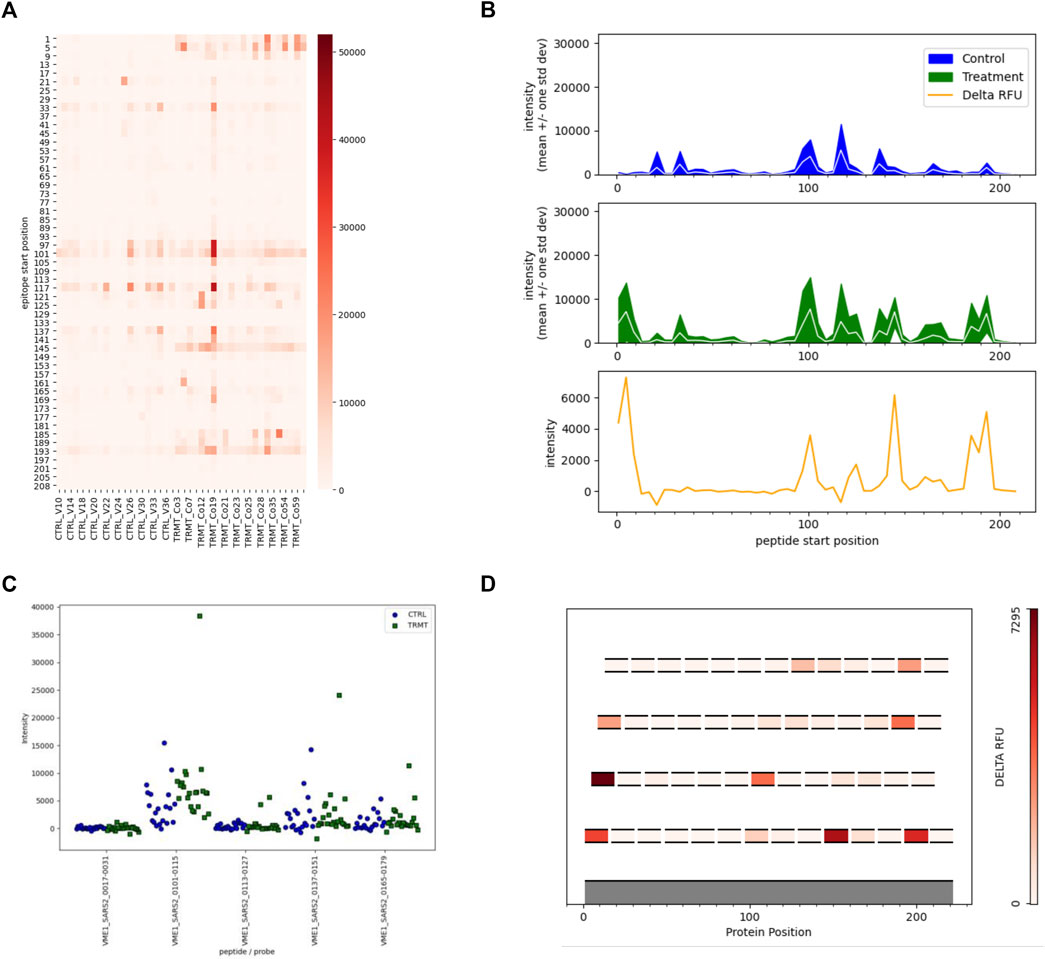 Figure by Parker Cates Z, Facciuolo A, Hogan D, Griebel PJ, Napper S and Kusalik AJ (2021) EPIphany—A Platform for Analysis and Visualization of Peptide Immunoarray Data. Front. Bioinform. 1:694324. doi: 10.3389/fbinf.2021.694324. © 2021 Parker Cates, Facciuolo, Hogan, Griebel, Napper and Kusalik.